

『debris flow potential area』 Stream Statistics
-
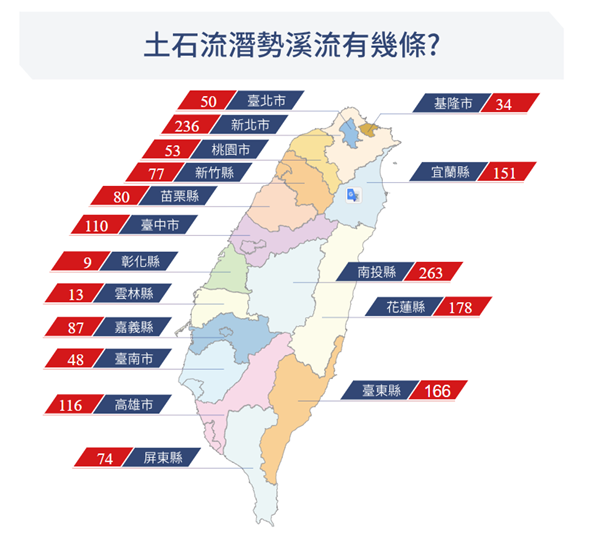
1.9 new 『debris flow potential area』 streams were added in the 114th year (of the Minguo calendar), bringing the total number of 『debris flow potential area』 streams nationwide to 1,745. They are distributed across 17 counties (cities), 159 townships (towns, cities, districts), and 692 villages (neighborhoods), with 792 streams located in indigenous areas. The related data and the master table of debris flow warning criteria values were released on January 14, 114th year (of the Minguo calendar) on the Debris Flow and Large-Scale Collapse Disaster Prevention Information Website of this Agency. The public is welcome to check online.
-
2.Villages (neighborhoods) that are not part of the publicly announced 『debris flow potential area』 stream villages but are located within the affected area: Yide Village in Sansing Township and Yuanshan Village in Sansing Township, Yilan County; Dapu Borough in Sanxia District, Luyi Borough in Wugu District, Xiushan Borough in Xizhi District, Xinghua Borough in Sanzhi District, Zhongliao Borough in Tamsui District, Songde Borough in Ruifang District, New Taipei City; Yonglong Borough in Taiping District, Zhongkeng Borough in Heping District, Taichung City; Yongfeng Village in Shuili Township and Nanguang Village in Shuili Township, Aiguo Village in Xinyi Township, Nantou County; Fuxing Borough in Tianzhong Township, Changhua County; Minong Borough in Meinong District, Kaohsiung City; Wanjin Village in Wanluan Township and Chengde Village in Wanluan Township, Pingtung County; Yong'an Village in Luye Township, Taihe Village in Taimali Township, Taitung County; Qingfeng Village in Ji'an Township, Hualien County, totaling 20 villages/neighborhoods. The number of the above is not included in the statistics table.
| Number of Debris Flow Potential Streams | ||||
|---|---|---|---|---|
| County / City | Protected Households within the Affected Area |
Subtotal New streams added in R.O.C. Year 114 |
||
| 5 Households or More | 1–4 Households | No Households | ||
| Yilan County | 28 | 67 | 56 | 151 (+1) |
| Keelung City | 6 | 5 | 23 | 34 |
| Taipei City | 5 | 5 | 40 | 50 |
| New Taipei City | 82 | 111 | 43 | 236 (+1) |
| Taoyuan City | 12 | 18 | 23 | 53 |
| Hsinchu County | 41 | 25 | 11 | 77 |
| Miaoli County | 36 | 30 | 14 | 80 |
| Taichung City | 43 | 45 | 22 | 110 |
| Changhua County | 6 | 2 | 1 | 9 |
| Nantou County | 129 | 99 | 35 | 263 |
| Yunlin County | 2 | 6 | 5 | 13 |
| Chiayi County | 25 | 42 | 20 | 87 |
| Tainan City | 7 | 25 | 16 | 48 |
| Kaohsiung City | 54 | 48 | 14 | 116 (+1) |
| Pingtung County | 35 | 22 | 17 | 74 (+3) |
| Taitung County | 62 | 44 | 60 | 166 |
| Hualien County | 73 | 55 | 50 | 178 (+3) |
| Total | 646 | 649 | 450 | 1745 (+9) |
頁面頂端