

Delimitation Method
I. Preliminary Delimitation of the Affected Area
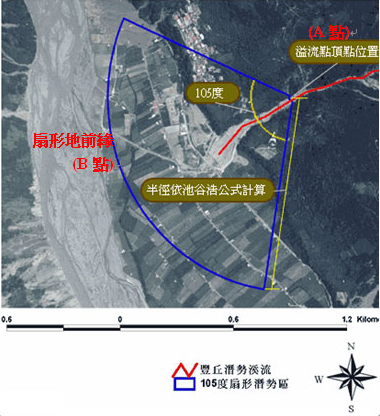
The delimitation method is based on the location of the valley mouth and/or the overflow point and the angle of the alluvial fan. The radius length of the alluvial fan is calculated using Ikeda's formula.
- Delimiting the Affected Area: Determine Vertex A of the affected area—defined as the valley exit, the alluvial fan apex, or a point with a slope of 10 degrees. From Point A, a fan-shaped area is projected downstream, based on the maximum debris flow expansion angle (105 degrees). Finally, the contour line B with a slope of 2 degrees within the fan area is used as the debris flow terminus boundary. The area enclosed by the fan-shaped region and line B is the final debris flow affected area.
-
Alluvial Fan Radius Length: The radius length of the alluvial fan is calculated using Ikeda's formula, as shown below:
Where V is the Sediment Discharge Volume (90% Non-Exceedance Probability) $(m^{3})$, ; $V=70,992A^{0.61}$; A is the area of the 『catchment area』 above the overflow point $(km^{2})$; L is the Deposition Length (m); $\theta_{\alpha}$ is the slope of the flow zone.
Log(L) = 0.42 × Log(V × tanθα) + 0.935
II. Field Revision of the Debris Flow Affected Area
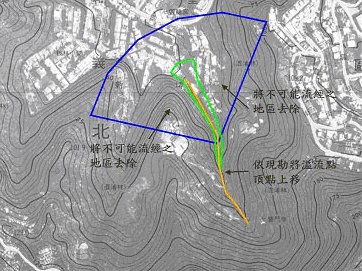
- Using the preliminary 105-degree fan-shaped area estimated by Ikeda's formula as the base map, the overflow points are repositioned based on field survey results (e.g., valley mouth, obstructions, or areas of sudden slope decrease). The boundary is then revised according to the local topography, excluding areas that debris flow cannot possibly traverse. If the fan radius calculated by Ikeda's formula is insufficient to cover the entire area of protected households, the radius length is extended based on the field survey's findings. Furthermore, if the field investigation reveals additional overflow points near protected households that are not on the base map, the affected area for the stream is expanded according to the aforementioned field delimitation principles.
- If the field investigation determines that there are no protected households near the stream's overflow point, the debris flow affected area will not be delimited for that stream.
III. Indoor Editing of the Debris Flow Affected Area
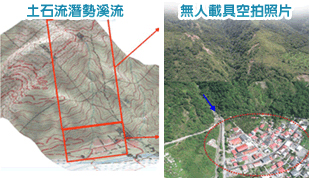
Based on the GPS coordinates of the stream and overflow points obtained from the field survey, and the field-revised debris flow affected area base map, the indoor process involves overlaying and editing the data to create a digital layer using 1:5,000 black-and-white aerial photo base maps or color orthophoto images.
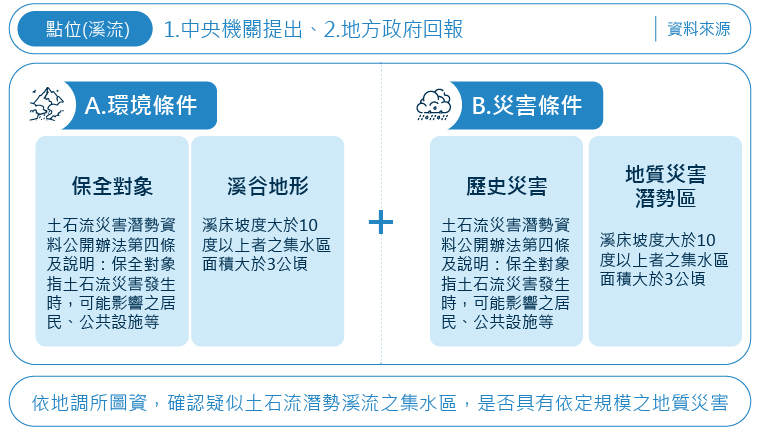
IV. Standard Procedure for Determining New Debris Flow Potential Streams
V. Debris Flow Affected Area Delimitation Steps
- Preliminary Delimitation of the Affected Area
- Field Revision of the Debris Flow Affected Area
- Indoor Editing of the Debris Flow Affected Area
Debris Flow Risk Level Assessment
Note: Any publicly released 『debris flow potential stream』 whose affected area contains no protected households, or only public facilities whose competent authority has corresponding control measures in place, shall be reclassified as "Continuous Observation" level.
Content of Investigation Work
I. Determination of Occurrence Potential Level:
| Score Distribution Table for Occurrence Potential Factors | ||
|---|---|---|
| Factor | Classification | Score |
| Landslide Magnitude (25) | Significant Large-Area Collapse | 25 |
| Small-Scale Collapse | 15 | |
| No Apparent Collapse | 5 | |
| Slope Factor (25) | Upstream Area Slope > 50° | 25 |
| Upstream Area Slope between 30° and 50° | 15 | |
| Upstream Area Slope < 30° | 5 | |
| Sediment Deposit Status (20) | Average Particle Size > 30 cm | 20 |
| Average Particle Size between 7.5 cm and 30 cm | 13 | |
| Average Particle Size < 7.5 cm | 2 | |
| No Apparent Deposit Material | 2 | |
| Lithology Factor (15) Note 1 | Type I (A, D, F Geological Zones) | 15 |
| Type II (C, E Geological Zones) | 15 | |
| Type III (B, G Geological Zones) | 5 | |
| Vegetation Factor (15) | Bare Rock, Rockfall Accumulation | 15 |
| Sparse Vegetation | 15 | |
| Moderately Sparse Vegetation | 6 | |
| Dense Vegetation | 3 | |
| Total Maximum Score | 100 | |
Note 1: A refers to the Taitung Rift Valley, Eastern Coastal Range; B refers to Schist, Gneiss; C refers to Metamorphosed Sandstone; D refers to Sedimentary Rock; E refers to Lateritic Terrace; F refers to Igneous Rock; G refers to Basin and Plain.
II. Determination of Protected Household Level:
| Protected Household Factor Distribution Table | ||
|---|---|---|
| Factor | Classification | Score |
| Buildings (65) | Public facilities related to disaster prevention measures (schools, medical facilities, public shelters, etc.) | 65 |
| 5 or More Residential Households | 60 | |
| 1 to 4 Residential Households | 30 | |
| No Households | 0 | |
| Transportation Facilities (35) | Bridge | 35 |
| Road | 20 | |
| None | 0 | |
| Total Maximum Score | 100 | |
| Effectiveness of Local Mitigation (100%) | Needs Improvement or No Mitigation Facilities | 100% |
| Acceptable | 80% | |
| Good or No Mitigation Required | 60% | |
| Assessment Result | Assessment Result = (Buildings + Transportation Facilities) × Weight | |
頁面頂端